Charts are invaluable ways to visualize data that would otherwise be difficult to comprehend. Rather than presenting blocks of data, consider transforming it into a chart to clarify trends, quickly estimate key values, and be more widely understood by the users of your information. It’s a good idea to stay up to date on the top chart maker tools as the options are increasing frequently. Looking for a free chart maker? Enjoy our collection of 10 free online chart maker tools and elevate your chart designs!

The Assortment of Free Chart Maker Tools: Fun and Free
Venngage

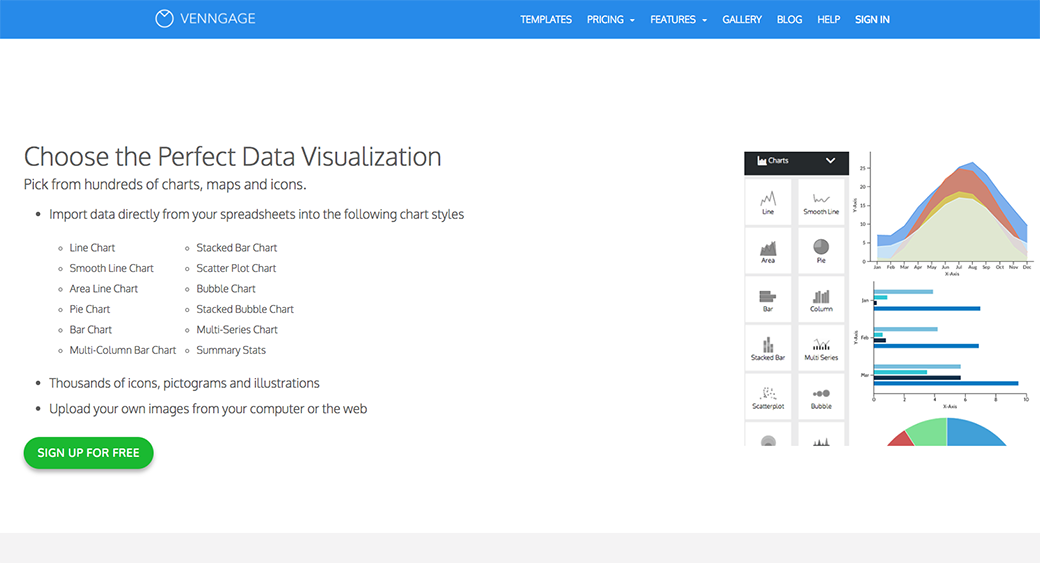
Venngage has you covered if you’re looking for a free chart maker, online graph maker, online flowchart maker, and infographic maker. They make it super simple to configure charts and add them quickly to your designs. You don’t have to start from scratch, as they offer templates that complement common chart designs. Sharing is also extremely simple and useful: Save your data visualizations as images or embed them live on your blog. All charts are perfectly formatted for easy social media sharing.
You can create the following charts with their tool: Line, Smooth Line, Area, Stacked Area, Pie, Half Pie, Bar, Stacked Bar, Column, Stacked Column, Multi Series, Scatterplot, Bubble, Stacked Bubble, Cloud Bubble, Word Cloud, TreeMap, 3D Column, 3d Stacked, 3D Pie, Pyramid, and Funnel. Check out their free chart maker today!
Visme Free Chart Maker
GanttPRO
If you are engaged in project management, you need a solid tool to launch and manage your projects with a team immediately. GanttPRO Gantt chart maker will help you build only one type of chart – a Gantt diagram. But how efficient it is in creating them! It allows visualizing all project-related data like tasks, dates, and resources in a very convenient way that is easy to understand. Advanced export to PNG, PDF, and XLSX formats and quick sharing are available.
AM Charts
AMCharts utilizes programming libraries to enhance your data visualization needs. They offer the following charts: Line, Area, Column, Pie, Bar, XY, Scatter, Candlestick, OHLC, Gauge, Funnel, and Stock. The free version is available with a backlink added to your created charts.
Charte
Your charts can be enhanced with Charte’s free chart maker. Register for an account and you can select from over 20 chart types, share your designs, and use their HTTP API to keep your charts up-to-date. To make it even better, no coding or design skills are required.
LiveGAP
LiveGap Charts lets you create custom charts with their free chart maker for many different purposes. They allow you to create line charts, pie charts, area charts, bar charts, doughnut charts, stacked bars, radar charts, polar charts, and step charts. Sharing is simple: Specify your chart type, enter your data into the spreadsheet panel, or paste it from any spreadsheet.
Chart.js
Chart.js recently rolled out new features, including mixed chart types, new chart axis types (to plot complex datasets on date time), and new engaging transitions when changing data. Chart.js is also responsive, open source, offers 8 chart types, and has an HTML5 Canvas.
Lucidchart
Lucidchart has risen in popularity due to its smooth user experience and easy to learn user interface. Users enjoy the ability to collaborate with their teams on their designs and the large selection of templates. They also have a diagram and online flowchart maker that you should try. You can check out their free chart maker here.
Plotly
Plotly offers many features that are worth to check out if you want to create amazing charts with a free chart maker. You can easily import data to charts, create stunning slide decks and dashboards, and track charts linked to their data, authors, and version history. A handy feature that they offer includes zoom/pan features and clickable legends.
Vizzlo
It’s important to have a free chart maker and online graph maker that increases productivity. Vizzlo does that by providing users with tools to create charts quickly. They help hundreds of thousands of users with their online flowchart maker in more than 120 countries with their chart creation needs. To create a chart, all you do is import your data, adding your corporate look, and share it online.
Chartblocks
If you don’t know how to code, no problem! Chartblocks allow you to build charts and graphs with their diagram maker and no coding skills are required. You can control almost every aspect of your chart with hundreds of customization options. Get started in no time with their chart building wizard.
Organimi Free Chart Maker
Organimi offers many features that chart makers routinely demand: bulk photo upload, drag & drop functionality, multi-paper size printing, multi-image download, custom fields, several sharing options, public URL or embedding, and chart format & branding customization options and several sharing options.
Free Chart Maker Tools Summary
Regardless of your specific chart creation needs, the tools mentioned below will surely have you covered! A free chart maker is a great tool to communicate complex information. Take some time to check out the options and you’ll soon be on your way to creating stunning charts.
